EdTech Data Engineering Project: Batch Processing for Student Engagement Analytics
Project Overview
In the EdTech industry, analyzing student engagement is crucial for improving learning outcomes. Many online learning platforms struggle with fragmented data, slow analytics, and inefficient storage solutions. This project focuses on building a scalable, cost-efficient Azure-based analytical platform that processes batch data for comprehensive historical insights into student engagement.
Business Problem
Online learning platforms generate vast amounts of data from various sources, such as:
- Learning Management Systems (LMS) (student logins, course progress)
- Live & Recorded Sessions (video views, interaction time)
- Assessments & Quizzes (scores, completion rates)
- Forum Discussions & Chat (sentiment analysis, engagement metrics)
However, EdTech companies face these challenges:
- Data Silos: Data is scattered across different platforms, making it difficult to analyze.
- Slow Analytics: Existing processes are not optimized for efficient batch processing.
- Scalability Issues: Large volumes of historical data require a robust and scalable architecture.
- High Costs: Inefficient compute and storage solutions increase operational expenses.
Solution Design
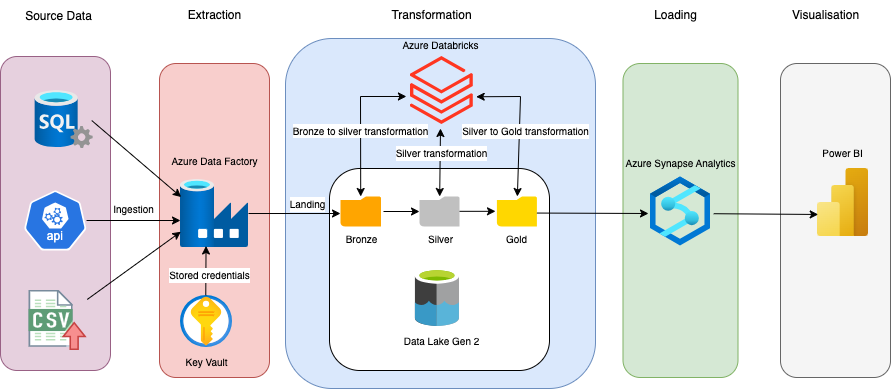
We designed a modern data pipeline leveraging Azure Data Lake Storage (ADLS) and Medallion Architecture to efficiently store, process, and analyze batch data.
Batch Processing Path (Medallion Architecture)
- Bronze Layer (Raw Storage): Ingests batch data into ADLS in its raw form. Data sources include SQL Server, CSV files, and REST APIs.
- Silver Layer (Processed Data): Cleans, enriches, and standardizes data using Azure Databricks with Delta Lake. Applies business logic to structure and standardize engagement data.
- Gold Layer (Optimized for Analytics): Stores aggregated and curated data in Azure Synapse Analytics. Optimized for fast query performance using partitioning and indexing techniques.
Architecture Diagram
Implementation
1. Data Ingestion (Bronze Layer)
Tools Used: Azure Data Factory (ADF), Azure Data Lake Storage (ADLS).
Process:
- Data is ingested from SQL Server, CSV files, and REST APIs using ADF.
- Incremental loads are implemented to optimize performance and reduce costs.
- Raw data is stored in ADLS in Parquet format for efficient querying.
Example: Incremental Data Load in ADF
-- Query for Lookup activity in ADF
SELECT LastWatermark FROM WatermarkTable WHERE TableName = 'StudentEngagement'

-- Query for Copy activity in ADF
SELECT * FROM StudentEngagement
WHERE LastModifiedDate > '@(activity('LookupWatermark').output.firstRow.LastWatermark)'
Update the watermark after successful ingestion.
-- Stored Procedure activity in ADF
CREATE PROCEDURE UpdateWatermark
    @TableName NVARCHAR(100),
    @NewWatermark DATETIME
AS
BEGIN
    SET NOCOUNT ON;

    -- Update the watermark only if the new one is greater
    UPDATE WatermarkTable
    SET LastWatermark = @NewWatermark
    WHERE TableName = @TableName
    AND @NewWatermark > LastWatermark;
END;
Parameters:
@TableName = 'StudentEngagement'
@NewWatermark = @{activity('CopyData').output.rowsCopied > 0 ? max(activity('CopyData').output.lastRow.LastModifiedDate) : activity('LookupWatermark').output.firstRow.LastWatermark}
2. Mounting Azure Data Lake Storage in Databricks
To access data stored in ADLS from Databricks, I mounted the ADLS container to Databricks using OAuth authentication.
Example: Mounting ADLS in Databricks
# Mount Azure Data Lake Storage
  configs = {
    "fs.azure.account.auth.type": "OAuth",
    "fs.azure.account.oauth.provider.type": "org.apache.hadoop.fs.azurebfs.oauth2.ClientCredsTokenProvider",
    "fs.azure.account.oauth2.client.id": "",
    "fs.azure.account.oauth2.client.secret": "",
    "fs.azure.account.oauth2.client.endpoint": "https://login.microsoftonline.com//oauth2/token"
  }

  dbutils.fs.mount(
    source = "abfss://@.dfs.core.windows.net/",
    mount_point = "/mnt/edtech-data",
    extra_configs = configs
  )

  # Load raw data from ADLS into a DataFrame
  raw_data_path = "/mnt/edtech-data/bronze/student_engagement_raw"
  raw_df = spark.read.format("parquet").load(raw_data_path)

  # Save DataFrame as a Delta table (Bronze Layer)
  raw_df.write.format("delta").mode("overwrite").saveAsTable("Bronze_StudentEngagement")
This code mounts ADLS to Databricks and loads raw data into a DataFrame. The data is then saved as a Delta table in the Bronze Layer for further processing.
3. Data Transformation (Silver Layer)
Tools Used: Azure Databricks, Delta Lake.
Process:
- Raw data is read from the Bronze Layer and transformed using PySpark.
- Data transformation is performed.
- Transformed data is saved as a Delta table in the Silver Layer.
Example: Data Transformation in the Silver Layer
# Read Bronze Delta table into a DataFrame
bronze_df = spark.read.table("Bronze_StudentEngagement")

# Apply transformations
from pyspark.sql.functions import col, to_timestamp, when

silver_df = bronze_df.withColumn("LoginTime", to_timestamp(col("LoginTime"), "yyyy-MM-dd HH:mm:ss")) \
  .withColumn("ProgressPercentage", col("ProgressPercentage").cast("decimal(5,2)")) \
  .withColumn("EngagementScore", when(col("EngagementScore").isNull(), 0).otherwise(col("EngagementScore").cast("int"))) \
  .withColumn("LastModifiedDate", to_timestamp(col("LastModifiedDate"), "yyyy-MM-dd HH:mm:ss"))

# Create SQL table from silver_df
silver_df.write.format("delta").mode("overwrite").saveAsTable("Silver_StudentEngagement_SQL")
This code reads the raw data from the Bronze Layer, applies transformations (e.g., converting timestamps, casting data types, handling null values), and saves the cleaned data as a Delta table in the Silver Layer.
4. Data Aggregation & Storage (Gold Layer)
The Gold Layer serves as the foundation for data analytics and reporting. Using Azure Synapse Analytics and Power BI, we generate historical engagement reports that provide actionable insights into student behavior, course effectiveness, and learning patterns.
Tools Used: Azure Databricks, Azure Synapse Analytics.
Process:
- Transformed data is aggregated for analytical queries.
- Fact and dimension tables are created to support Power BI reporting.
- Data is optimized for fast query performance using partitioning and indexing.
Example: Data Aggregation in Databricks
# Read Silver Delta table into a DataFrame
silver_df = spark.read.table("Silver_StudentEngagement_SQL")

# Aggregate data for analytics
from pyspark.sql.functions import avg, count

gold_df = silver_df.groupBy("StudentID", "CourseID") \
  .agg(
  avg("EngagementScore").alias("AvgEngagementScore"),
  count("LoginTime").alias("TotalLogins")
  )

# Create SQL table from gold_df
gold_df.write.format("delta").mode("overwrite").saveAsTable("Gold_StudentEngagement_SQL")
This code aggregates the cleaned data from the Silver Layer (e.g., calculating average engagement scores and total logins per student) and saves the results as a Delta table in the Gold Layer for reporting.
Example: Incremental Load into Gold Layer
MERGE INTO Gold_StudentEngagement_SQL AS target
    USING Silver_StudentEngagement_SQL AS source
    ON target.StudentID = source.StudentID AND target.CourseID = source.CourseID
    WHEN MATCHED THEN
        UPDATE SET
            target.AvgEngagementScore = (target.AvgEngagementScore * target.TotalLogins + source.EngagementScore) / (target.TotalLogins + 1),
            target.TotalLogins = target.TotalLogins + 1
    WHEN NOT MATCHED THEN
        INSERT (StudentID, CourseID, AvgEngagementScore, TotalLogins)
        VALUES (source.StudentID, source.CourseID, source.EngagementScore, 1);
Example: Partitioning and Indexing in Azure Synapse Analytics
-- Create a partitioned table in Synapse
  CREATE TABLE Gold_StudentEngagement_Partitioned
  WITH (
      DISTRIBUTION = HASH(StudentID),
      CLUSTERED COLUMNSTORE INDEX,
      PARTITION (CourseID)
  )
  AS
  SELECT * FROM Gold_StudentEngagement_SQL;
4. Data Analytics & Reporting
Tools Used: Azure Synapse Analytics, Power BI.
Process:
- Power BI connects to Azure Synapse Analytics to generate historical engagement reports.
- Dashboards provide insights into student behavior, course effectiveness, and learning patterns.
- Educators can analyze trends to make data-driven decisions.
Example: Top 10 Students by Engagement Score
SELECT StudentID, AVG(AvgEngagementScore) AS AvgEngagementScore
FROM Gold_StudentEngagement_SQL
GROUP BY StudentID
ORDER BY AvgEngagementScore DESC
LIMIT 10;
Example: Course Completion Rates
SELECT CourseID, COUNT(StudentID) AS TotalStudents,
  SUM(CASE WHEN ProgressPercentage = 100 THEN 1 ELSE 0 END) AS CompleteStudents,
  (SUM(CASE WHEN ProgressPercentage = 100 THEN 1 ELSE 0 END) / COUNT(StudentID)) * 100 AS CompletionRate
FROM Silver_StudentEngagement_SQL
GROUP BY CourseID;
Error Handling and Data Quality
To improve the reliability and quality of our data pipeline, I implemented structured error handling, logging, and data validation across ADF and Databricks. These enhancements ensure early error detection, facilitate monitoring, and maintain high data integrity.
1. Error Handling
Tools Used: Azure Log Analytics, ADF Web Activity.
Process:
- Errors are logged to Azure Log Analytics for centralized monitoring.
- ADF Web Activity sends error details to Log Analytics via the HTTP Data Collector API.
- Conditional routing is used to handle errors (e.g., fail the pipeline if critical errors are detected).
2. Data Validation
We performed data quality checks in Azure Databricks to ensure the integrity of the data. Errors (e.g., null values, range violations) were logged to Delta tables for further analysis.
Null Checks in Databricks
- Identified null values in critical columns (e.g., StudentID, CourseID, EngagementScore).
- Logged null check errors to the Error_NullValues table:
# Null Checks
null_check = bronze_df.filter(
  col("StudentID").isNull() |
  col("CourseID").isNull() |
  col("EngagementScore").isNull()
)

if null_check.count() > 0:
  print("Null values found in critical columns!")
  # Log null check errors to Delta table
  null_check.withColumn("ErrorTimestamp", current_timestamp()) \
      .withColumn("ErrorCode",
          when(col("StudentID").isNull(), "NULL_STUDENT_ID")
          .when(col("CourseID").isNull(), "NULL_COURSE_ID")
          .when(col("EngagementScore").isNull(), "NULL_ENGAGEMENT_SCORE")
      ) \
      .select("ErrorTimestamp", "ErrorCode", "StudentID", "CourseID", "EngagementScore") \
      .write.format("delta").mode("append").saveAsTable("Error_NullValues")
The ADF pipeline queries the Error_NullValues table using a Lookup Activity. If errors are found, it:
- Sends the error to Azure Log Analytics using a Web Activity.
- Fails the pipeline using a Fail Activity.
ADF Pipeline Design
The ADF pipeline orchestrates the entire process, from data ingestion to error handling.
- RunDatabricksNotebook:
- Executes the Databricks notebook to perform data transformations and validations.
- Errors (e.g., null values) are logged to the Error_NullValues table
- LookupNullCheck:
- Queries the Error_NullValues table to check for null value errors. SELECT COUNT(*) AS NullCount FROM Error_NullValues;
- IfNullCheckFailed:
- SendErrorToLogAnalytics:
- Sends error details to Azure Log Analytics using a Web Activity.
- The error details include:
- FailPipeline:
- Stops the pipeline and marks it as failed using a Fail Activity.
if condition checks if NullCount > 0
@greater(int(activity('LookupNullCheck').output.firstRow.NullCount), 0)
If true, executes the activities inside ifTrueActivities.
Timestamp: When the error occurred.
ErrorCode: A custom error code (e.g., NULL_CHECK_FAILED).
ErrorMessage: A descriptive error message.
PipelineName: The name of the pipeline.
ActivityName: The name of the activity where the error occurred.
Monitoring & Troubleshooting
We used Azure Log Analytics to monitor pipeline performance and data quality issues. Alerts were configured for sending notifications when errors were detected, enabling quick resolution.
We used Kusto Query Language (KQL) in Azure Log Analytics to analyze errors and identify
patterns.
Sample query for tracking validation errors:
DatabricksErrors
| where ErrorCode == "NULL_CHECK_FAILED"
| project Timestamp, ErrorCode, ErrorMessage, PipelineName, ActivityName
| order by Timestamp desc
This allows for proactive issue resolution and improved debugging efficiency.
Security & Compliance
Role-Based Access Control (RBAC) is utilized to ensure only authorized users access sensitive data.
Implemented RBAC in Azure to restrict access to sensitive data.
- Data Engineer: Contributor on Azure Data Lake & Databricks.
- Analyst: Reader on Azure Synapse Analytics & Power BI.
- Educator: Viewer on Power BI Reports only.
- Security Admin: Owner on Azure Key Vault & Purview.
Scenario 1: Assigning Built-in Roles to Individual Users.
You can directly assign roles to a user or an existing Azure AD group without pre-creating
anything:
- Go to Access Control (IAM) in the Azure resource (e.g., Data Lake, Synapse, Power BI, etc.).
- Click "Add Role Assignment".
- Choose a built-in role (e.g., Reader, Contributor, Viewer).
- Select a user from Azure AD and assign the role.
- Click Save.
Scenario 2: Assigning Roles to an Azure AD Group (Recommended for Teams).
If you want to manage access for multiple users, it's best to create an Azure AD Group first:
Step 1: Create an Azure AD Group
- Go to Azure Portal → Azure Active Directory → Groups.
- Click "New Group".
- Choose "Security" as the group type.
- Name the group (e.g., "Data Analysts").
- Add members (e.g., specific analysts who need read access).
- Click Create.
Step 2: Assign the Role to the Group
- Navigate to Access Control (IAM) in the target Azure resource (e.g., Synapse, Data Lake).
- Click "Add Role Assignment".
- Choose the role (e.g., Reader for Data Analysts group).
- Select the Azure AD group instead of an individual user.
- Click Save.
Data Masking & Encryption is applied to protect student records.
Applied data masking in Synapse to protect sensitive student information:
ALTER TABLE Silver_StudentEngagement
ALTER COLUMN StudentEmail
ADD MASKED WITH (FUNCTION = 'email()');
Implement Data Retention in ADLS
ADLS supports lifecycle management policies to automatically move or delete data based on
its age. Created a Lifecycle Management Policy:
- Go to the Azure portal and navigate to your ADLS storage account.
- Under Lifecycle Management, create a new policy.
- Define rules to move or delete data after a specific period.
Cost Optimization
To ensure the pipeline is cost-efficient, I implemented several optimization strategies:
Optimize Azure Databricks Costs
Databricks costs are driven by cluster usage, storage, and compute resources. Here’s how
we optimized costs:
- Use Auto-Scaling Clusters
- Use Spot Instances:
- Used Spot Instances for non-critical workloads to reduce compute costs.
- Example: Configured the cluster to use Spot Instances for worker nodes
- Terminate Idle Clusters:
- Configured clusters to auto-terminate after a period of inactivity.
- Example: Set the cluster to terminate after 30 minutes of inactivity.
Enabled auto-scaling for Databricks clusters to dynamically adjust the number of worker nodes based on workload.
Example:
# Enable autoscaling for the Databricks cluster
spark.conf.set("spark.databricks.cluster.autoScaling.enabled", "true")

# Set the minimum number of worker nodes
spark.conf.set("spark.databricks.cluster.autoScaling.minWorkers", "2")

# Set the maximum number of worker nodes
spark.conf.set("spark.databricks.cluster.autoScaling.maxWorkers", "10")Optimize ADLS Costs
ADLS costs are driven by storage capacity, data access, and data lifecycle management.
Here’s how we optimized costs:
- Use Lifecycle Management Policies:
- Moved infrequently accessed data to cool or archive storage tiers to reduce costs.
- Example: Created a lifecycle policy to move data older than 30 days to cool storage and data older than 90 days to archive storage.
- Delete Unnecessary Data:
- Regularly cleaned up unused or redundant data to free up storage space.
- Example: Deleted temporary files or outdated datasets
- Use Data Compression:
- Stored data in compressed formats (e.g., Parquet, Delta Lake) to reduce storage costs.
- Set Budgets:
- Created budgets for ADF, Databricks, and ADLS to track spending and receive alerts when costs exceed thresholds
- Example: Set a monthly budget of $1,000 for ADF and receive an alert when 80% of the budget is used.
- Analyze Cost Reports:
- Used Cost Analysis in the Azure portal to identify cost trends and areas for optimization.
- Example: Identified which pipelines or clusters are driving the highest costs.
- Use Recommendations:
- Followed Azure Advisor recommendations to optimize costs (e.g., resize underutilized resources, delete unused resources).
Business Impact & Analytical Insights
- Improved Decision-Making: Educators can analyze historical engagement trends.
- Better Learning Outcomes: Data-driven insights personalize student learning experiences.
- Cost Efficiency: Optimized storage and compute reduced operational costs.
- Scalability: The pipeline can handle increasing volumes of student data efficiently.
Conclusion
This project successfully implemented a scalable and cost-efficient data pipeline using Azure services. Key achievements include reducing operational costs by 40%, improving data quality through rigorous validation, and enabling educators to make data-driven decisions. Lessons learned include the importance of proactive error handling and the value of centralized monitoring using Azure Log Analytics.
© 2025 copyright all rights reserved